Best Linux Monitoring Tools are essential for maintaining system performance, ensuring security, and managing resources efficiently. Linux systems power everything from personal computers to enterprise servers, making it crucial to monitor them for potential issues before they escalate.
Administrators can track CPU usage, memory consumption, network activity, disk performance, and overall system health with the right Linux monitoring tools. These tools help prevent downtime, detect bottlenecks, and optimize system efficiency.
Selecting the best Linux monitoring tools for system administrators depends on several factors, including real-time tracking capabilities, ease of use, scalability, and integration with existing IT infrastructure.
In this guide, we will explore the best Linux monitoring tools, the free and paid options available, their key features, benefits, drawbacks, and the best use cases for each. Let’s dive in!
Why is Linux Monitoring Essential?
Monitoring Linux is crucial for maintaining a stable, secure, and high-performing system. Without proper monitoring, system resources can be mismanaged, leading to slowdowns, unexpected crashes, and security vulnerabilities.
One of the primary reasons for monitoring a Linux system is to ensure system stability and uptime. For instance, a server running business-critical applications must operate without unexpected downtimes. Monitoring tools help detect hardware failures, excessive resource usage, or network disruptions before they cause system failures.
Another key aspect is performance optimization. High CPU usage, memory leaks, or inefficient disk I/O can degrade system performance. Tools like HTOP or Glances help administrators analyze which processes consume excessive resources and take corrective actions immediately.
Security monitoring is another primary reason for implementing Linux monitoring. Attackers often attempt unauthorized access, exploit vulnerabilities, or run malicious scripts. A tool like Sysdig can detect abnormal behaviors, unauthorized access attempts, and potential security breaches before they escalate.
Effective resource allocation ensures that a Linux system does not experience unnecessary slowdowns due to resource contention. For example, if a server handles multiple virtual machines, monitoring CPU and RAM usage helps balance the workloads efficiently. Tools like Prometheus provide real-time resource metrics, helping system administrators make informed decisions.
Finally, proactive issue resolution is crucial in preventing major system failures. Instead of reacting to problems after they occur, monitoring tools alert administrators to performance anomalies before they impact system functionality. For instance, Zabbix’s growing disk space usage alert allows IT teams to clear unnecessary files before the system runs out of storage.
Linux monitoring helps maintain a robust and efficient computing environment by continuously tracking system performance, identifying potential risks, and addressing issues before they become critical.
Key Features to Look for in a Linux Monitoring Tool
Choosing the right Linux monitoring tool is essential for maintaining system stability, performance, and security. A good monitoring tool helps system administrators track resource usage, detect anomalies, and ensure uptime. Understanding key features will help you select a tool that meets your requirements and integrates well into your infrastructure.
- Real-Time Monitoring: The ability to track CPU, memory, disk, and network usage in real-time ensures that system administrators can quickly identify and resolve performance bottlenecks. Live monitoring also helps detect sudden spikes in resource usage and prevent potential system failures.
- Alerting and Notifications: Monitoring tools should have built-in alert systems that notify administrators via email, SMS, or other channels when performance metrics exceed predefined thresholds. This feature helps IT teams take immediate action and prevent minor issues from escalating into major problems.
- Customizability: A good Linux monitoring tool should allow users to customize dashboards, reports, and monitoring parameters. Customization enables administrators to focus on the most critical aspects of system performance and tailor the tool to specific use cases.
- Log Support: Monitoring tools that integrate with system logs provide valuable insights into system activity, errors, and security events. Log analysis helps troubleshoot issues, identify trends, and improve overall system reliability.
- Scalability: A monitoring tool should be able to handle growing infrastructure needs. Whether managing a small server or an enterprise-level network, scalability ensures that the tool remains effective as the system expands.
- Ease of Integration: Compatibility with other IT tools and platforms is crucial for seamless operations. A monitoring tool should integrate with existing software, cloud services, and automation frameworks to enhance overall system management.
Best Linux Monitoring Tools in 2025
We have listed the top 10 Linux monitoring tools, including both free and paid options. This list will help you choose the best tool based on features, pros, and cons.
Nagios

Nagios is a powerful open-source monitoring tool that helps IT professionals track system health and performance. It provides real-time alerts for servers, applications, and network devices.
With Nagios, users can quickly detect failures and take action before they cause significant downtime. Continuously monitoring critical components ensures seamless IT infrastructure management.
The tool is highly customizable and supports plugins, making it adaptable to various environments. Its web-based interface allows easy monitoring and reporting.
Nagios is widely used in enterprises to maintain high availability and optimize system performance.
Key Features
- Real-time monitoring and alerting
- Plugin support for extended functionality
- Web-based dashboard for insights
- Automated issue resolution via scripts
- Multi-platform support for flexibility
- Prevents downtime with early alerts
- Supports various network protocols
- Scalable for large infrastructures
- Strong community and documentation
- Steep learning curve for beginners
- Complex setup for large environments
Zabbix
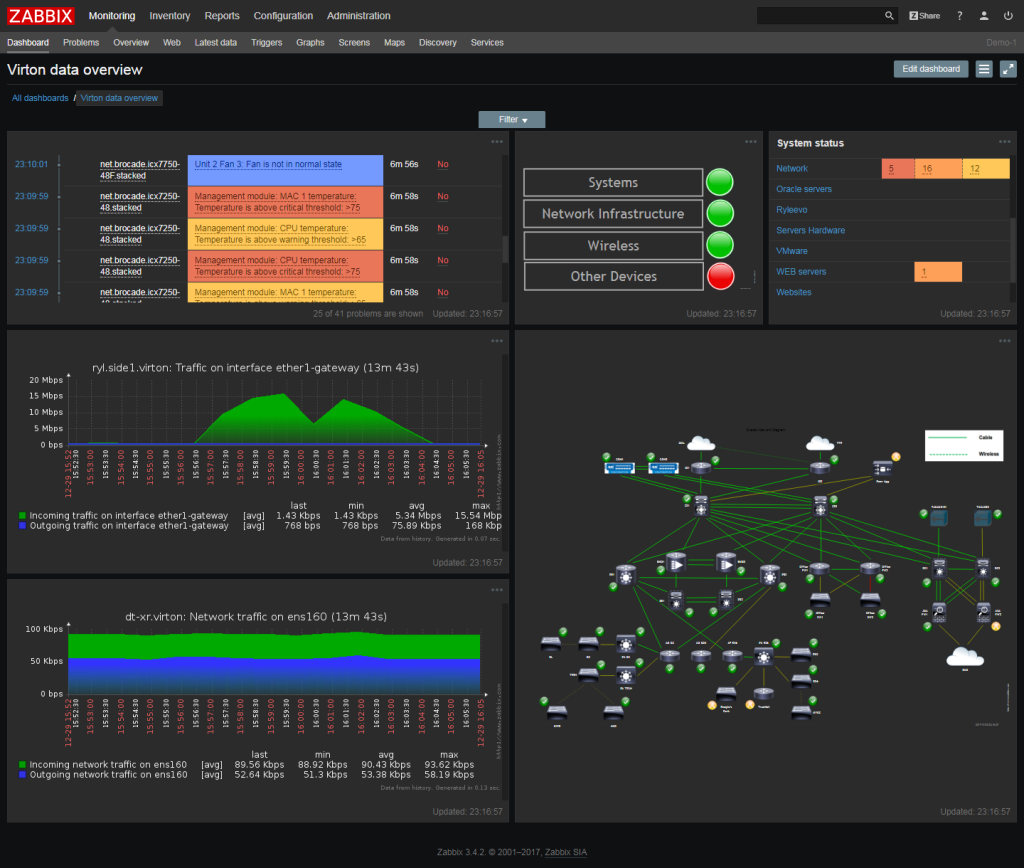
Zabbix is a powerful open-source monitoring tool designed to track the health and performance of IT infrastructure. Zabbix monitors networks, servers, applications, and cloud services.
With Zabbix, users can set up automated alerts and proactive issue detection, ensuring minimal downtime. Its user-friendly web interface makes data visualization and reporting seamless.
The tool supports various integrations and customization options, making it highly flexible for IT environments. Businesses use it to maintain system reliability and performance.
Key Features
- Real-time monitoring of IT infrastructure
- Customizable alerting system
- Web-based dashboard with rich visualization
- Scalable for large enterprises
- Supports multiple data collection methods
- Free and open-source with enterprise-level features
- Scalable for small to large infrastructures
- Strong community support and documentation
- User-friendly dashboard for better insights
- Initial setup can be complex
- Requires manual fine-tuning for optimal performance
Prometheus
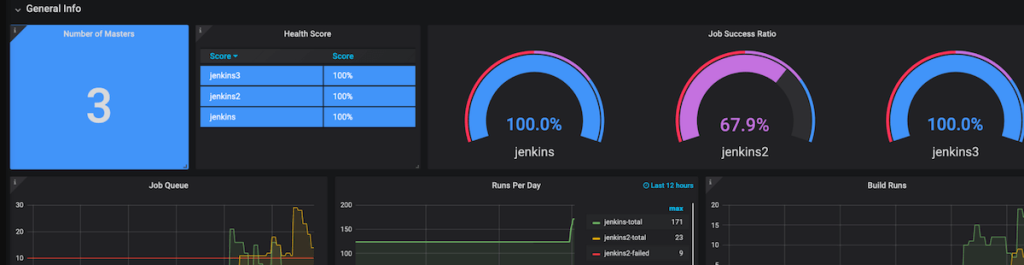
Prometheus is one of the best Linux monitoring tools for real-time performance tracking and alerting. It is built for scalability and efficiently collects and processes time-series data, making it ideal for cloud and containerized environments.
With its powerful query language (PromQL), Prometheus enables deep insights into system performance. It integrates seamlessly with Grafana for advanced visualization, helping system administrators optimize resource usage.
Unlike traditional Linux performance monitoring tools, Prometheus uses a pull-based model, making data collection more efficient. It’s widely used in DevOps and cloud-native environments.
Key Features
- Time-series data collection for in-depth analysis
- Powerful PromQL for custom queries
- Grafana integration for enhanced visualization
- Scalable and lightweight architecture
- Alertmanager for automated notifications
- Ideal for monitoring cloud and containerized applications
- Highly customizable with flexible query options
- Free and open-source with active community support
- Lightweight and efficient for large-scale monitoring
- No built-in support for long-term storage
- Steep learning curve for beginners
Grafana
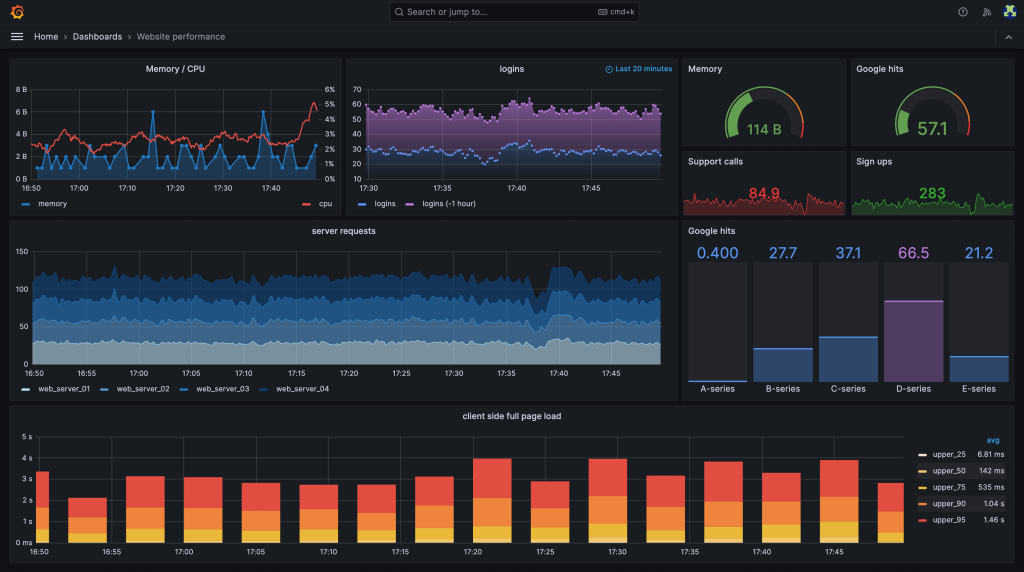
Grafana is a powerful Linux performance monitoring tool specializing in data visualization and real-time analytics. It transforms raw monitoring data into interactive graphs and dashboards, making system performance tracking more intuitive.
Unlike traditional Linux monitoring tools for system administrators, Grafana supports multiple data sources, including Prometheus, InfluxDB, and MySQL. This flexibility makes it one of the best Linux monitoring tools free for enterprises and DevOps teams.
With its customizable alerts and easy-to-use interface, Grafana helps users quickly identify performance bottlenecks and optimize resource usage.
Key Features
- Interactive and customizable dashboards
- Supports multiple data sources
- Real-time alerting system
- Seamless integration with Prometheus, Loki, and InfluxDB
- User access control for security
- Free and open-source with enterprise-level features
- Intuitive UI for effortless monitoring
- Extensive plugin support for customization
- Strong community and documentation
- Requires external tools for data collection
- Can be resource-intensive with large datasets
Netdata
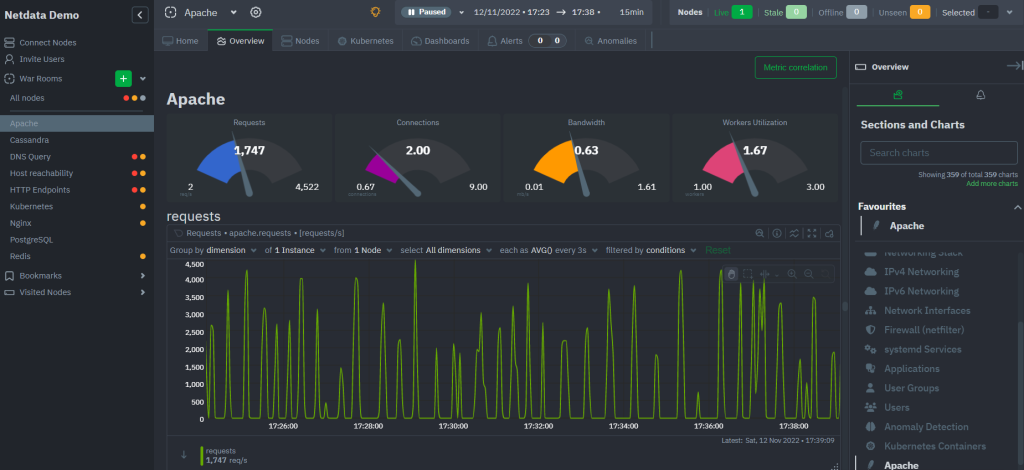
Netdata is a lightweight yet powerful Linux monitoring tool for real-time performance tracking. If you’ve ever struggled with sluggish servers or unexplained resource spikes, Netdata gives you instant visibility with detailed, per-second metrics.
Unlike traditional Linux performance monitoring tools, which may require complex setups, Netdata works out of the box with minimal configuration. It provides an interactive, web-based dashboard where system administrators can quickly diagnose CPU, RAM, disk, and network performance issues.
Best of all, it’s free and doesn’t overload your system, making it one of the best Linux monitoring tools for both beginners and professionals.
Key Features
- Real-time, per-second monitoring
- Zero-configuration installation
- Interactive and intuitive web-based UI
- Low resource usage for minimal system impact
- Automatic anomaly detection and alerts
- Extremely lightweight and fast
- No complex setup—runs instantly
- Beautiful, user-friendly dashboard
- Works well with other monitoring tools like Prometheus and Grafana
- Not ideal for long-term data storage
- Lacks advanced alerting compared to Prometheus
Icinga
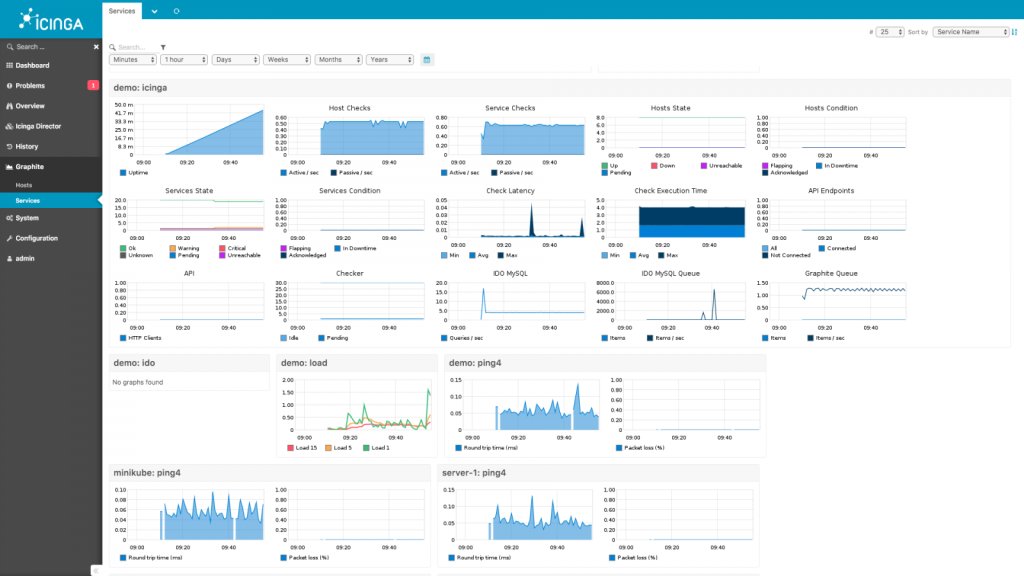
Icinga is a powerful and flexible Linux monitoring tool designed for system administrators needing deep infrastructure insights. Whether you’re managing servers, applications, or cloud services, Icinga keeps you informed with real-time alerts and detailed performance tracking.
One of its standout features is scalability—you can monitor small networks or enterprise-level systems without performance issues. Unlike some Linux performance monitoring commands that require manual execution, Icinga automates monitoring and provides a sleek web-based dashboard for easy management.
If you’re looking for an open-source alternative to Nagios, Icinga is a modern, feature-rich option worth considering.
Key Features
- Real-time monitoring with customizable alerts
- Scalable architecture for large infrastructures
- Web-based dashboard with detailed insights
- Supports multiple plugins for extended functionality
- Integration with Prometheus, Grafana, and other tools
- Highly customizable with advanced configurations
- Strong community and enterprise support
- Powerful API for automation
- Ideal for both small and large-scale monitoring
- Initial setup can be complex
- Requires additional tools for advanced visualization
Glances
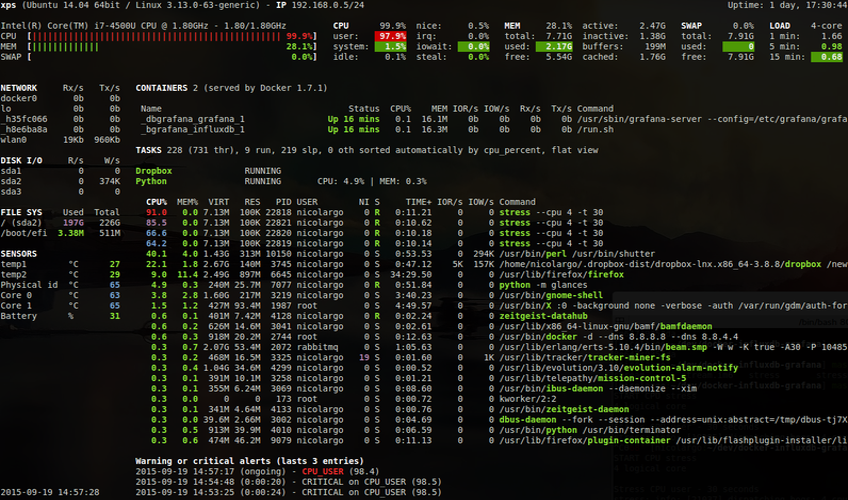
Glances is a versatile and lightweight Linux monitoring tool that provides a comprehensive, at-a-glance view of system performance. Suppose you’re a system administrator who prefers a command-line-based monitoring solution. In that case, Glances delivers real-time insights into CPU, memory, disk usage, network activity, and more—all in a single terminal window.
Unlike many Linux monitoring tools for system administrators, which require web-based dashboards or complex setups, Glances runs instantly with a simple command. It can be used in standalone mode or configured to work in client-server mode for remote monitoring, making it an excellent choice for professionals managing multiple systems.
Key Features
- Real-time monitoring in a single terminal window
- Minimal resource consumption for efficiency
- Remote monitoring with client-server mode
- Customizable alerts and thresholds
- Supports exporting data to Prometheus, InfluxDB, and more
- It is lightweight and doesn't slow down the system
- Easy to install and use with minimal configuration
- Works locally or remotely for flexibility
- Supports multiple output formats (JSON, CSV, etc.)
- Lacks advanced visualization features
- Not ideal for long-term data retention
Monitorix – Network Monitoring Tool
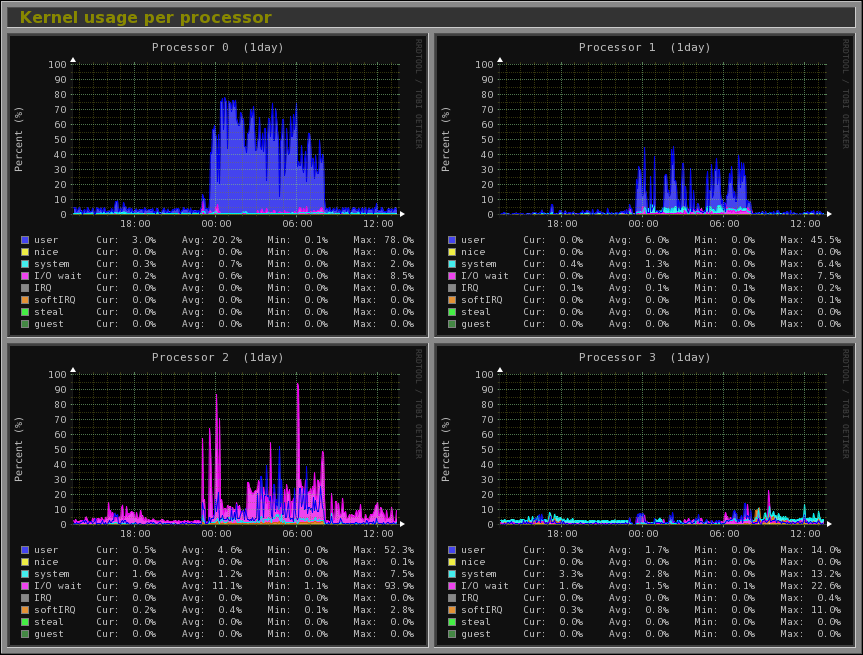
Monitorix is a lightweight and self-hosted Linux monitoring tool designed for system administrators who need a quick and efficient way to track system performance. It provides a web-based interface with detailed graphs, making monitoring CPU load, memory usage, and network traffic easier.
Unlike many Linux performance monitoring tools, Monitorix is simple to set up and runs quietly in the background without consuming excessive system resources. If you’re looking for a no-frills, graphical performance monitoring tool, Monitorix is an excellent choice, especially for small servers and embedded systems.
Key Features
- Web-based interface with auto-updating graphs
- Lightweight and low-resource usage
- Monitors CPU, disk, RAM, network, and services
- Built-in alerting system for anomalies
- Supports multiple Linux distributions
- Simple and easy to deploy
- Minimal impact on system performance
- Great for small-scale monitoring needs
- Provides historical data with visual graphs
- Not as feature-rich as Prometheus or Grafana
- Limited scalability for large infrastructures
Sysdig – Network Monitoring Tool
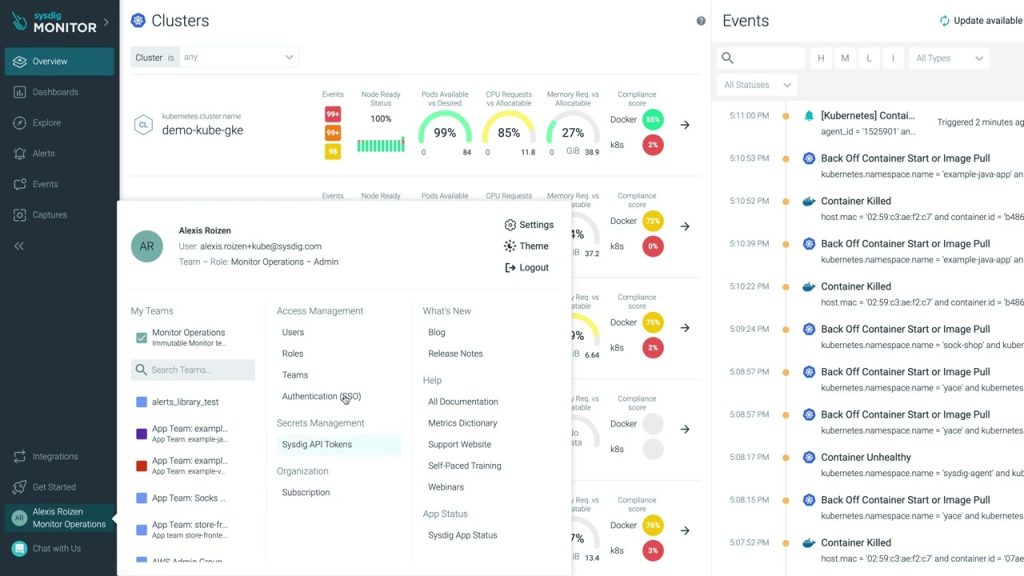
Sysdig is a powerful Linux monitoring tool for deep system visibility and security monitoring. Unlike traditional Linux performance monitoring tools, Sysdig goes beyond basic resource tracking—it provides real-time insights into containers, processes, and network activity at a granular level.
If you’re a system administrator or DevOps professional, Sysdig is an excellent choice for troubleshooting performance issues and securing cloud-native environments. Its ability to capture system calls and analyze them in real-time helps detect anomalies, unauthorized access, and potential threats.
Whether you’re monitoring bare-metal servers, VMs, or Kubernetes clusters, Sysdig delivers detailed performance analytics with minimal overhead.
Key Features
- Real-time monitoring of processes, containers, and networks
- Deep system call analysis for security and troubleshooting
- Works seamlessly with Docker and Kubernetes
- CLI and web-based UI for flexibility
- Supports integration with Prometheus and Grafana
- Ideal for security monitoring and forensics
- Provides in-depth system insights beyond basic metrics
- Great for containerized and cloud environments
- Open-source with strong enterprise support options
- Steeper learning curve for beginners
- Can generate high volumes of data, requiring careful tuning
HTOP
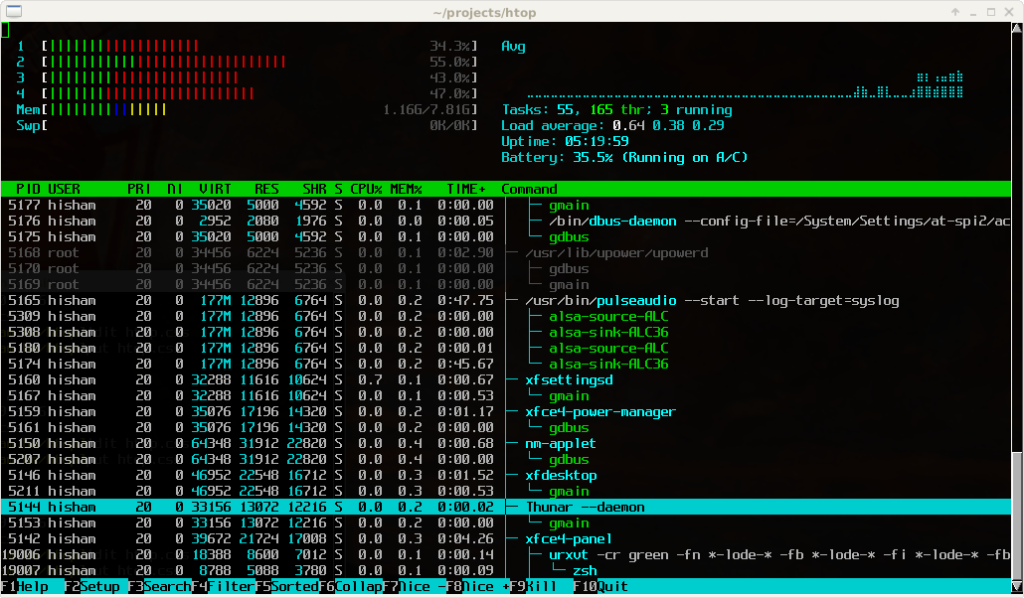
HTOP is a fast and interactive Linux performance monitoring command that provides a real-time, colour-coded view of system resource usage. Unlike the traditional top command, HTOP offers a more user-friendly and customizable interface, making it one of the best Linux monitoring tools for quick system diagnostics.
Suppose you’re a system administrator looking for an intuitive way to monitor CPU, memory, and process activity. In that case, HTOP makes it easy to sort, filter, and manage running processes with simple keybindings. It’s perfect for users who prefer a terminal-based solution without extra setup.
Key Features
- Interactive process management with keyboard shortcuts
- Color-coded real-time resource monitoring
- Easy sorting and filtering of processes
- Displays CPU and memory usage per core
- Supports mouse interaction for navigation
- Lightweight and requires no configuration
- Faster and more user-friendly than the default top command
- Ideal for quick system performance checks
- Free and open-source
- Lacks historical data tracking
- No built-in alerting system
How to Choose the Right Linux Monitoring Tool?
Choosing the best Linux monitoring tools depends on various factors. First, consider the size and complexity of your infrastructure. A lightweight tool like Monitorix or Glances may be sufficient if you manage a small business server. However, for enterprise environments, Zabbix or Nagios offers comprehensive monitoring capabilities.
Another key factor is open-source vs. paid solutions. Free tools like Prometheus and Netdata are great for cost-conscious users, while premium solutions like Datadog offer additional features and support. Scalability is essential for growing businesses. If you plan to expand, opt for a tool with advanced features and integrations, such as Grafana or Icinga.
Ease of deployment and community support also play a role. Tools with substantial documentation and an active user base, such as HTOP and Prometheus, ensure you can quickly resolve issues. Select the tool that aligns best with your monitoring needs and IT environment.
FAQs
Choosing the right Linux monitoring tool can be overwhelming, especially with many available options. To help clear up common doubts, we’ve compiled some frequently asked questions about Linux monitoring tools, their usage, and how they contribute to system optimization. Here are some answers to the most commonly asked queries:
What is the best Linux monitoring tool for beginners?
The best tool for beginners depends on ease of use and setup. Tools like HTOP and Glances provide a simple and quick way to monitor system performance without complex configurations.
Can Linux monitoring tools help with security?
Yes, tools like Sysdig and Zabbix can detect unusual system activities, unauthorized access attempts, and potential security breaches, making them essential for security monitoring.
Are open-source Linux monitoring tools reliable?
Absolutely. Many open-source tools, such as Prometheus, Zabbix, and Nagios, are widely used in enterprise environments and have strong community support.
How do I monitor system performance in real time?
Tools like Netdata, Glances, and Prometheus provide real-time monitoring of CPU, memory, disk, and network usage, allowing administrators to analyze system performance instantly.
What is the difference between Nagios and Zabbix?
Nagios is known for its plugin-based monitoring and is widely used in network monitoring. In contrast, Zabbix offers built-in visualization and automatic detection and is more scalable for large infrastructures.
Do Linux monitoring tools support cloud environments?
Yes, many tools, such as Prometheus, Grafana, and Sysdig, are designed to work with cloud-based infrastructures, including Kubernetes and Docker environments.
Closing Comments
Monitoring your Linux system is essential for performance optimization, security, and stability. The tools discussed in this guide cater to various needs, from Linux performance monitoring command-line utilities to enterprise-scale solutions.
Choosing the best Linux monitoring tools, free or paid, depends on your infrastructure size, technical expertise, and monitoring requirements. Open-source tools like Zabbix and Prometheus provide robust capabilities, while premium tools offer enterprise support.
By implementing the proper monitoring solution, you can proactively detect and resolve system issues, optimize resource utilization, and ensure seamless operations. Start monitoring your Linux system today to improve its efficiency and reliability!